How can Claude Code find console errors and failed requests in my app?
Use Ascended Browser 0.1.5 to reproduce a local app failure, then correlate page behavior with console and network evidence. An error log is a clue, not a root-cause diagnosis.
Start with a running app and a connected client
Follow the QA quickstart to connect Codex CLI or Claude Code. Run your app's existing development command and use its actual URL; the prompt below assumes http://127.0.0.1:3000.
Use a disposable environment. Define one flow and the expected result before asking the agent to debug it. If the client runs on a remote dev box, localhost refers to that box.
Copy this bounded debugging prompt
Use Ascended Browser to debug http://127.0.0.1:3000.
Open the app and observe its controls. Ask me which flow to test if unclear.
Use disposable local data only; do not change source code yet.
You may submit local test forms, but stop before external messages,
purchases, deletions or other consequential actions.
Reproduce the selected flow once and record the page's actual behavior.
Read console errors and failed network requests on that same tab.
If a request is relevant, inspect the broader network log too: a 200
response can still accompany incorrect UI behavior.
Capture the broken layout or visible error if a screenshot adds evidence.
Report steps, expected versus actual, URL/status or console text,
what you directly observed, and what remains a hypothesis.
If an action is interrupted, inspect state before considering a retry.
Read the same tab's console and network logs
These are tool arguments, not shell commands. Replace TAB_ID with the ID returned by browser_open; your client may prefix tool names with the server name.
Console errors, browser_extract:
{"tab_id":"TAB_ID","read":"console","level":"error"}
Failed requests and HTTP 4xx/5xx, browser_extract:
{"tab_id":"TAB_ID","read":"network","failed_only":true}
API requests, including successes, browser_extract:
{"tab_id":"TAB_ID","read":"network","filter":"/api/","types":["fetch","xhr"]}
filter is a URL regular expression. Log reads default to the current navigation; navigations can include up to three retained navigations. If a result provides next_cursor, request the next page using cursor; don't assume the first page contains every entry.
Separate observations from explanations
- Pair the triggering action with the visible state and relevant request or console message.
- Distinguish HTTP error responses, request failures, uncaught exceptions and browser-tool errors.
- Check whether a third-party failure actually affects the selected flow.
- Record missing evidence rather than treating an empty log as a passing app test.
Logs are bounded, not a complete historical trace. Errors and warnings are recorded; log/info capture is limited to developer origins. Some same-site JSON bodies may be included; don't assume a complete HAR, every response body or production telemetry.
Keep a reproducible issue record
Report the app URL and version if known, actions in order, expected requirement, actual result, exact relevant evidence and uncertainties. Only report a reproduction count for attempts actually performed. After an authorized fix, rerun the same flow and compare its behavior, not just whether errors disappeared.
For interrupted submissions, follow inspect before retrying. A lost result does not prove the app rejected the action.
Evidence from the local fixture
On October 6, 2026, a real MCP client drove the published 0.1.5 package on Linux against a deliberately broken local fixture. Clicking Load products triggered these observed results:
Page: Products could not load (HTTP 503).
Console: error: Product load failed: HTTP 503 (inline)
Network: GET /api/products → 503 fetch
The test asserted that both logs contained 503. This is a manufactured failure for demonstration, not a production incident or a benchmark of an agent's reasoning. No fix/retest outcome is claimed.
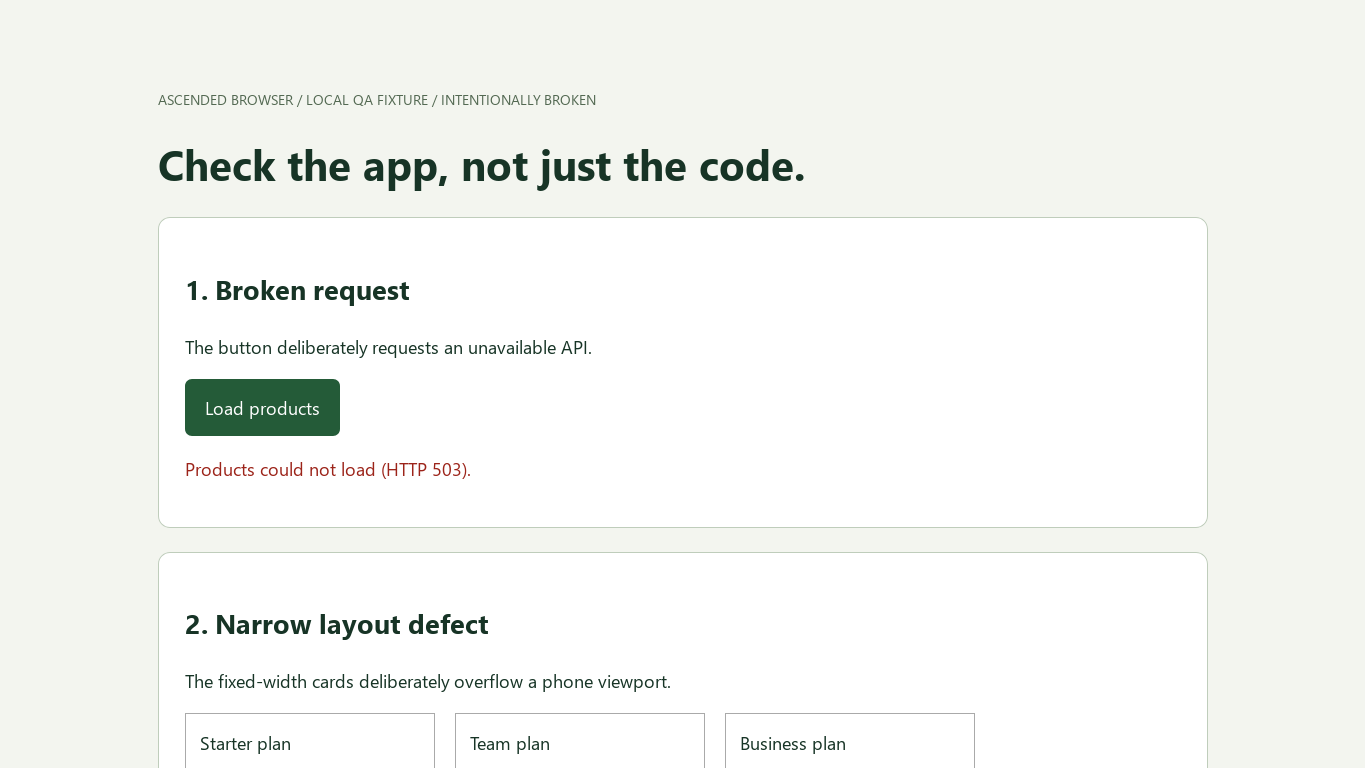
Reproduce the fixture
From the repository root, after the quickstart's virtual-environment setup:
.venv-qa/bin/python tests/qa_guides_demo.py
The harness starts a disposable local HTTP server, drives browser MCP tools, writes screenshots and receipts to site/assets/, and checks error capture and session reuse. The Python client, not Claude Code or Codex, performs these checks. Read the runnable fixture source.
Claude's Chrome integration and Chrome DevTools MCP are alternatives. Network and console inspection are not exclusive to Ascended.